Mining Help
Earnings and Hashrate History statistics
Tracking mining, hashrate, payments and statistics is done in the Rig Manager by toggling to the History & Stats section.

The interface is split into several sections each providing different information while some also provide the option to export the data.
1. Your Projected income
Provides a weekly, monthly and yearly projected income based on the current market conditions and hashrate provided.
2. Active workers
Shows the current Active workers and the following data for each worker:
- Worker: The worker name
- Algorithm: The algorithm currently being mined by the worker
- Diff: The current mining difficulty
- Accepted speed: The accepted hashrate that is provided by the worker
- Rejected speed: The hashrate that was rejected
- Current profitability: The current profitability based on the hashrate and market conditions
- Unpaid balance: The unpaid balance mined by the worker
- XNSUB: Is XNSUB enabled
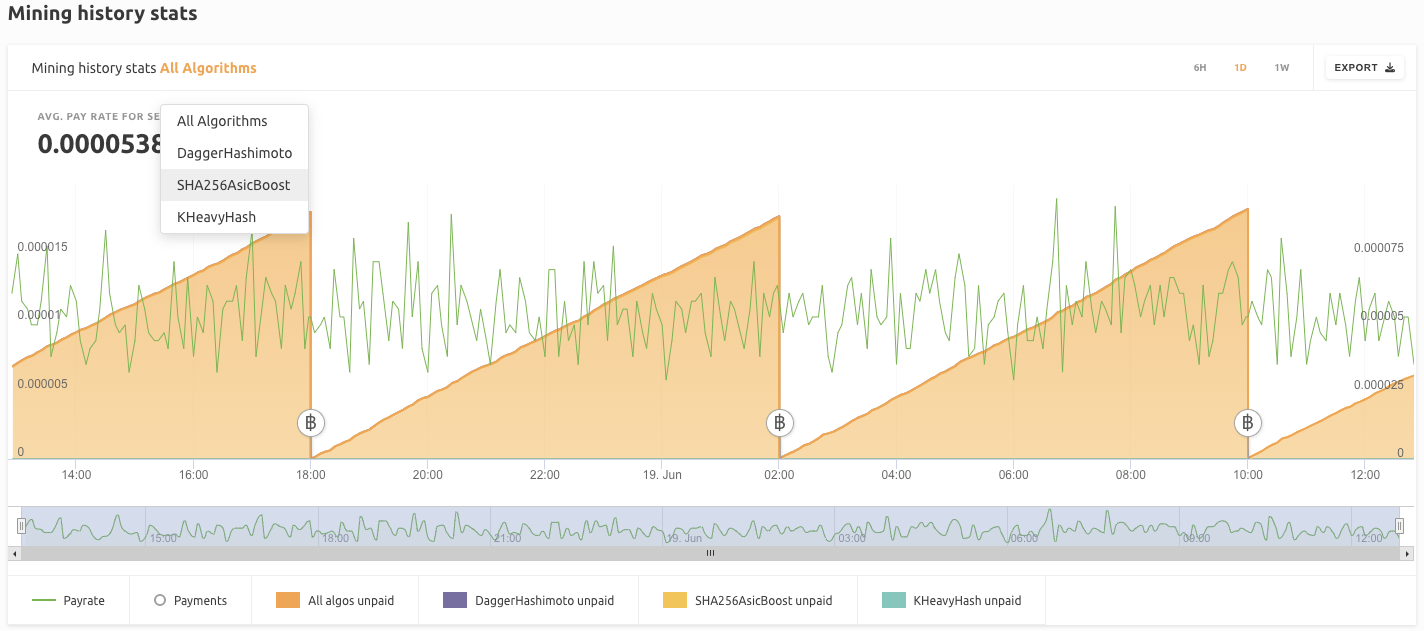
3. Mining history stats
An interactive graph that can be configured to show the mining and payment statistics for All algorithms or each algorithm individually. It can be configured to show the data for 6h, 1 Day or 7 Days and also supports the option to Export the data shown. The time slider at the bottom of the graph can be shortened and extended as well as dragged left and right in order to fine-tune the time shown.
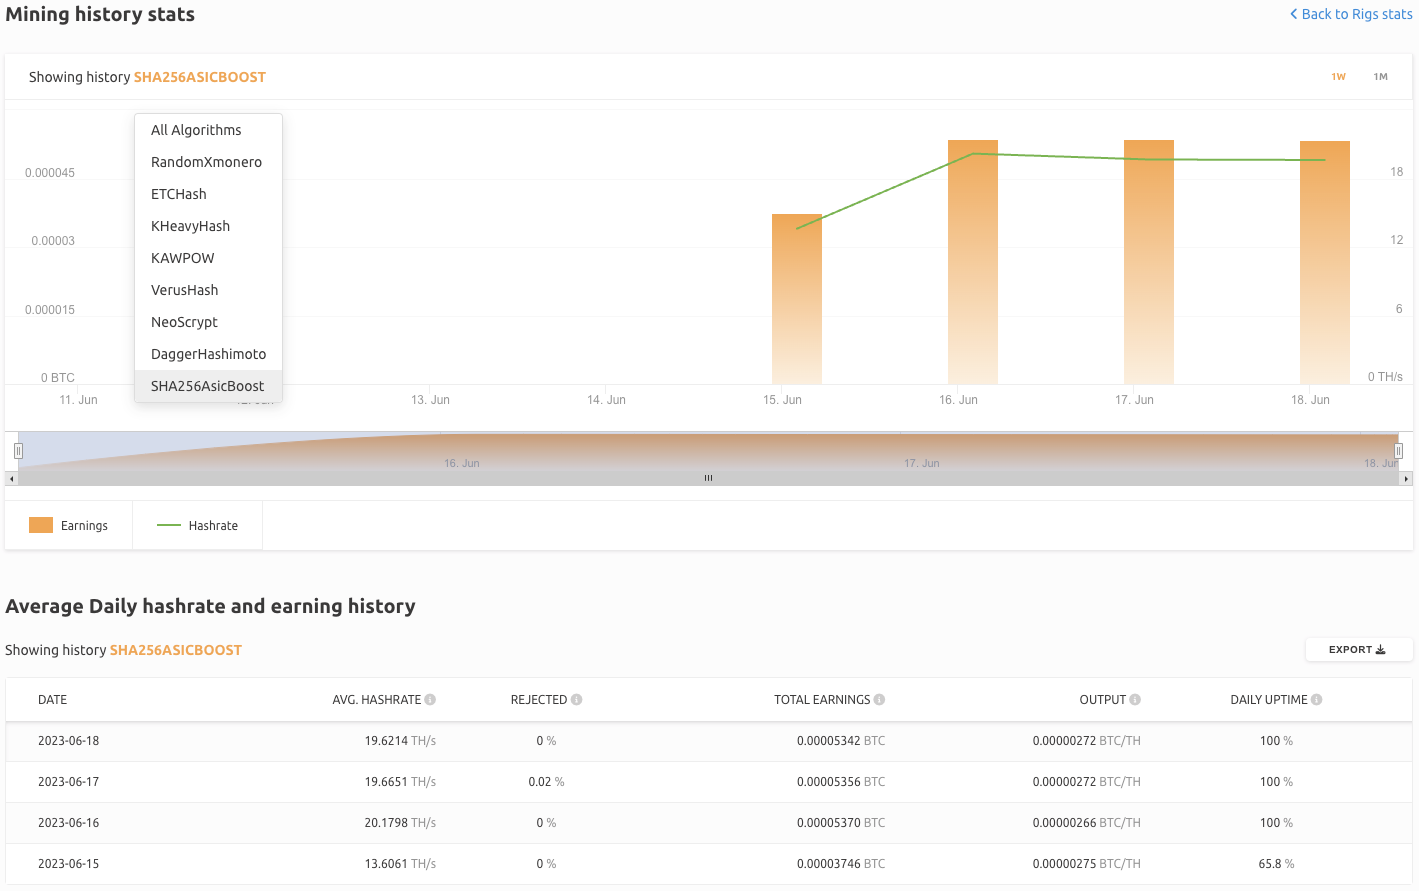
4. Average Daily hashrate and earning history
A chart showing the daily mining history for All Algorithms or each individual algorithm. It can be expanded with the Show More button which includes an interactive graph that can show the mining and earnings data for All Algorithms or each individual algorithm. It is configured to show the data for 1 Week or 1 Month.
The chart provides the following data:
- Date: Data for the following date
- Avg. Hashrate: The average total speed of all the workers. The sum of accepted and rejected speed on that specific date
- Rejected: The percentage of the rejected speed of Avg.Hashrate on that specific date
- Total Earnings: The total earnings on that specific date
- Output: Amount of BTC or USDT earned per unit of hashrate
- Daily Uptime: Percentage of the day that mining was recorded
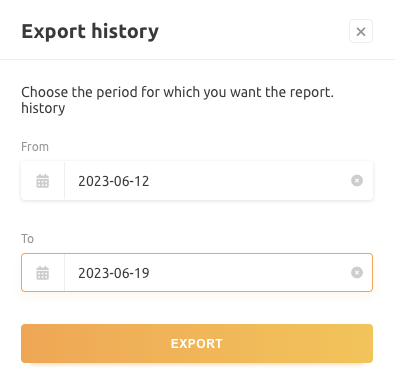
The data in the chart can also be exported by clicking on the Export button and selecting the desired timeframe.
5. Last mining payments
This section shows the latest mining payments and their BTC or USDT amount. The payments can be Grouped by day and Exported.