Introduction à Candlesticks
Si vous souhaitez échanger des crypto-monnaies, vous devez comprendre mouvements de prix. La façon la plus courante de représenter les mouvements de prix est de candlestick graph. Dans cet article de blog, nous allons vous montrer comment lire les candlestick et ce qu'ils représentent.
Candlestick les graphiques ont une longue histoire. Ils sont originaires du Japon. Au 18ème siècle, un négociant en riz japonais nommé Homma a été l'un des premiers individus à utiliser l'action historique des prix pour prédire les prix à l'avenir. Candlesticks' graphique a ensuite été introduit dans le monde occidental par Steve Nison.
Les types de candlesticks
Candlesticks peut être divisé en deux groupes:
- En hausse ou haussière (couleur verte ou blanche)
- décroissant ou baissier (couleur rouge ou noire)
Les parties de candlestick
The candlestick is based on the four prices of the asset over a given period of time: the opening price, highest price, lowest price, and closing price (OHLC).
The range between the opening and closing price is known as the body.
Thin lines above and/or below the candlesticks are known as the wicks and they are representing the lowest and highest price in the selected time period.
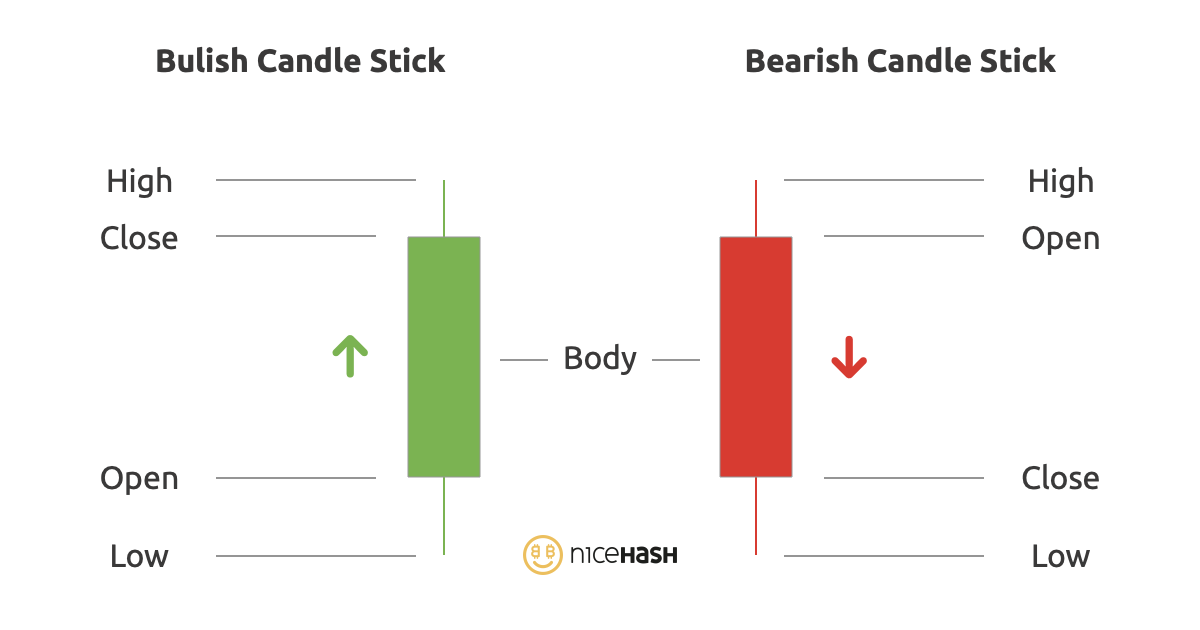
Bullish candlestick
An increasing or bullish candlestick is when the open position is below the close position as shown in the picture above. Above the close is the highest point of the candle and below the open is the lowest point of the candle in the selected time period.
Bearish candlestick
Decreasing or bearish candlestick is when the close position is below the open position. Regarding the wicks, it is the same as with the bullish candle. They represent the highest and lowest point of the candle in the selected time period.
Importance of timeframe
Why is the time period mentioned so many times? Because candlestick can be used in any timeframe from 1 minute to 1 month.
Each candle shows (represents) the time period we have chosen.
If we have chosen a time period of 30 minutes, 1 candle will represent a period of 30 minutes. If we have chosen a time period of 1 day, 1 candle will represent a period of 1 day.
The wicks will then present the highest and the lowest price at that selected time period.
Depending on the chosen time period, we also distinguish between short-term and long-term price trends.
The short time interval is mainly used in daily trading, while the longer time interval is used for long term investments and determining the general trend. (In the selected short time interval, there may be an upward trend, despite the long-term downward trend. And vice versa.)
Patterns
As time goes on, we can stack the candlesticks from left to right and we get a candlestick graph. Traders are very interested in patterns that candlesticks create.
There are simple candlestick patterns based on one candlestick position, and more advanced patterns involving multiple candlesticks in a row. We will go into more details and over some basic patterns in the next blog post. For now, all you need to know is that just like with the candlestick, patterns are also separated into two groups: bullish and bearish.